Regression
Regression is a type of supervised learning where the model learns to predict continuous values based on input features. It is used when the output variable is numerical, such as predicting house prices, stock prices, or temperature.

What type of relationship or pattern are you trying to model?
Is the relationship between your variables linear, nonlinear, or are you trying to forecast values over time?
Tips:
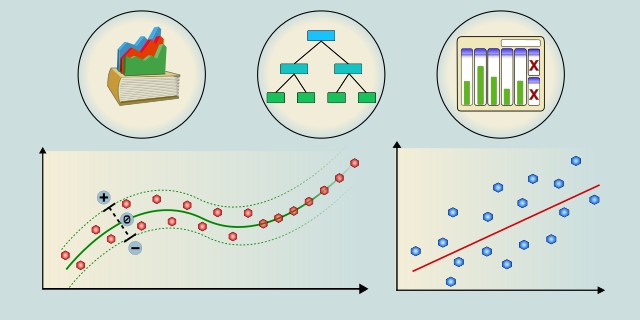
- If the relationship between your input features and target is approximately linear, choose Linear Regression.
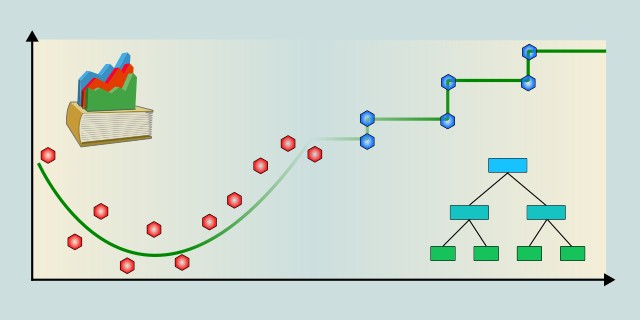
- If the relationship is complex and not well captured by a straight line, choose Non-Linear Regression.
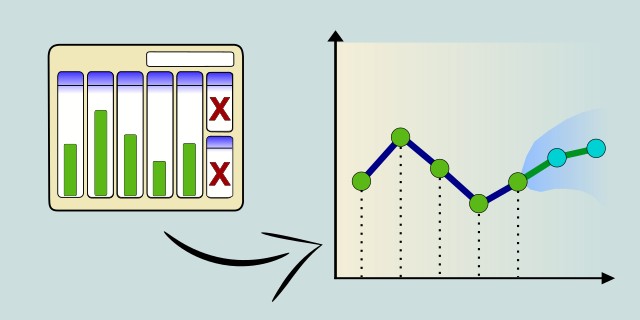
- If your goal is to predict future values based on past sequences over time, choose Time Series Forecasting.
Linear Regression

Linear regression is a fundamental algorithm used for predicting a continuous target variable based on one or more input features. It assumes a linear relationship between the input features and the target variable.
Linear regression is a fundamental supervised learning algorithm used for predicting a continuous target variable based on one or more input features. It assumes a linear relationship between the independent variables and the dependent variable, meaning the change in the output is proportional to the change in inputs. Linear regression models are easy to interpret and computationally efficient, making them popular for many practical applications. However, they are limited in capturing complex patterns in data where relationships are not linear. Despite this, linear regression serves as a strong baseline and is widely used for trend estimation, forecasting, and understanding variable impacts.
Use Case Examples:
- House Price Prediction: Estimating the price of a house based on size, location, and number of bedrooms.
- Salary Estimation: Predicting employee salaries based on experience and education level.
- Advertising Impact Analysis: Modeling how advertising spend influences sales revenue.
- Exam Score Prediction: Estimating students' scores based on study hours and attendance.
- GDP Growth Forecasting: Predicting economic growth rates based on historical data.
Non-Linear Regression

Non-linear regression is a type of regression analysis in which the relationship between the independent variable(s) and the dependent variable is modeled as a non-linear function. This allows for capturing complex relationships that cannot be adequately described by linear models.
Non-linear regression models the relationship between input features and the target variable using nonlinear functions. Unlike linear regression, it can capture more complex and intricate patterns in data where the relationship is not simply proportional. These models are powerful for real-world scenarios where data behavior is more complicated, but they are often harder to interpret and require more computational resources. Non-linear regression includes techniques like support vector regression with nonlinear kernels, decision tree regression, and neural networks. Choosing the right non-linear model depends on the data structure and the problem complexity.
Use Case Examples:
- Support Vector Regression (SVR): Predicting complex trends in stock prices where linear assumptions fail.
- Decision Tree Regression: Estimating energy consumption based on various environmental factors.
- Modeling Biological Systems: Capturing nonlinear relationships in gene expression data.
- Predicting Equipment Failure: Using sensor data to detect patterns preceding failures.
- Sales Forecasting with Seasonal Effects: Accounting for complex seasonal trends in product demand.
Time Series Forecasting

Time series forecasting is a technique used to predict future values based on previously observed values. It is widely used in various fields such as finance, economics, and environmental science to analyze trends and make informed decisions.
Time series forecasting involves predicting future values based on previously observed temporal data points. Unlike standard regression, time series methods explicitly account for the order and dependencies in the data over time. Techniques like ARIMA model the linear relationships and trends within time series, while more advanced models like LSTM (Long Short-Term Memory networks) can capture complex, nonlinear temporal patterns and long-term dependencies. Time series forecasting is widely used in domains where future planning and trend prediction are crucial. Challenges include handling seasonality, trends, and noise in the data.
Use Case Examples:
- Stock Price Prediction: Forecasting future stock prices based on historical market data.
- Weather Forecasting: Predicting temperature, rainfall, or other weather variables over time.
- Sales Demand Forecasting: Estimating product demand to optimize inventory management.
- Energy Consumption Prediction: Forecasting electricity usage for better grid management.
- Traffic Flow Prediction: Anticipating traffic patterns to improve transportation systems.
Feedback & Sharing
Give us your thoughts on this page, or share it with others who may find it useful.
Feedback
Found this helpful? Let me know what you think or suggest improvements 👉 Contact me.