Non-Linear Regression
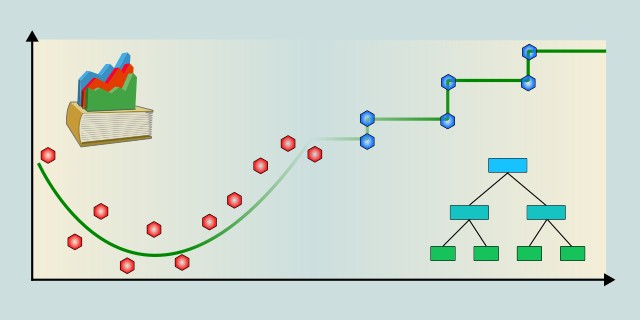
Non-linear regression is a type of regression analysis in which the relationship between the independent variable(s) and the dependent variable is modeled as a non-linear function. This allows for capturing complex relationships that cannot be adequately described by linear models.

How do you want to model non-linear relationships in your data?
Do you prefer margin-based models or tree-based splitting to handle non-linearity?
Tips:
- If your data benefits from robust margin-based optimization and you want to control the influence of outliers, choose SVR (Support Vector Regression).
- If your data is complex, has many feature interactions, or non-monotonic behavior, go with Decision Tree Regression.
Support Vector Regression

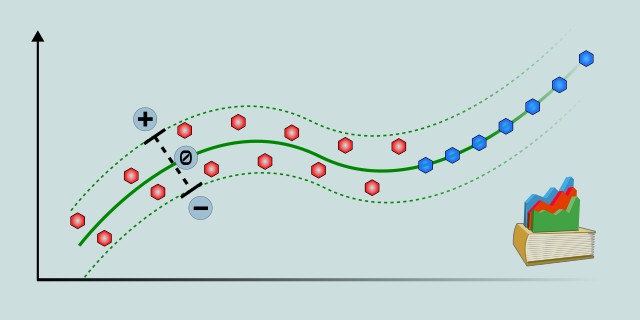
Support Vector Regression (SVR) is a regression technique based on Support Vector Machines (SVM). It aims to find a function that approximates the target values within a certain margin of tolerance, handling both linear and non-linear relationships through kernel functions.
SVR is effective for capturing complex, non-linear patterns in data by using kernel tricks like RBF or polynomial kernels. It focuses on fitting the data within a defined error margin, which makes it robust to outliers. However, SVR can be computationally intensive on large datasets and requires careful tuning of parameters like the kernel type, regularization, and epsilon margin.
Use Case Examples:
- Stock Price Prediction: Modeling non-linear trends in financial markets.
- Energy Load Forecasting: Predicting electricity consumption based on weather and usage patterns.
- Environmental Modeling: Estimating pollutant levels given multiple environmental factors.
- House Price Estimation: Capturing complex relationships between features and prices.
- Sensor Data Analysis: Predicting equipment failure times from sensor readings.
| Criterion | Recommendation |
|---|---|
| Dataset Size | 🟡 Medium |
| Training Complexity | 🔴 High |
Decision Tree Regression

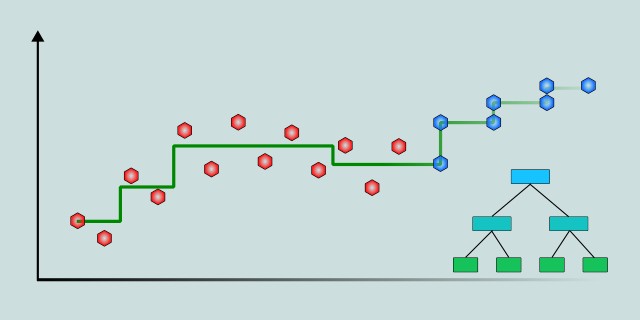
Decision Tree Regression uses a tree-like model to predict continuous target variables by learning decision rules inferred from data features. It splits the data into subsets based on feature values, capturing non-linear relationships without requiring a predefined functional form.
Decision Tree Regression is intuitive and interpretable, making it easy to visualize how decisions lead to predictions. It can model complex, non-linear relationships and handle both numerical and categorical features. However, it is prone to overfitting if the tree grows too deep, and it may require pruning or ensemble methods (like Random Forest) to improve generalization.
Use Case Examples:
- Real Estate Valuation: Predicting house prices based on various property features.
- Customer Lifetime Value Prediction: Estimating future value of customers from demographic and behavioral data.
- Demand Forecasting: Projecting product demand based on past sales and market conditions.
- Healthcare Outcomes: Predicting patient recovery times from clinical metrics.
- Crop Yield Estimation: Modeling agricultural yield from environmental and farming inputs.
| Criterion | Recommendation |
|---|---|
| Dataset Size | 🟡 Medium |
| Training Complexity | 🟡 Medium |
Feedback & Sharing
Give us your thoughts on this page, or share it with others who may find it useful.
Feedback
Found this helpful? Let me know what you think or suggest improvements 👉 Contact me.