Unsupervised Learning
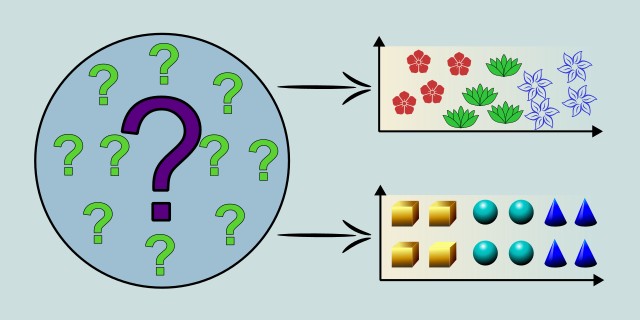
Unsupervised learning is a type of machine learning where the model learns patterns from unlabeled data without explicit instructions on what to predict.

What is your goal when working with unlabeled data?
Do you want to group data, reduce its complexity, or find meaningful associations between features?
Tips:
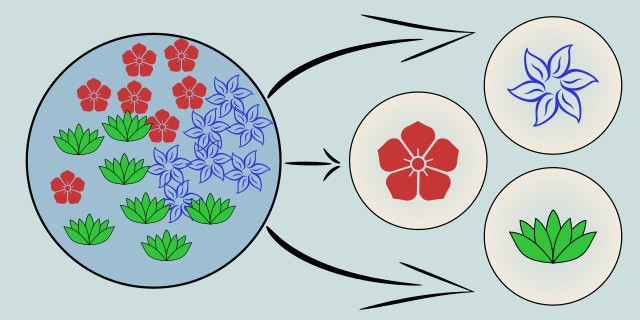
- If you want to group similar data points together, choose Clustering.
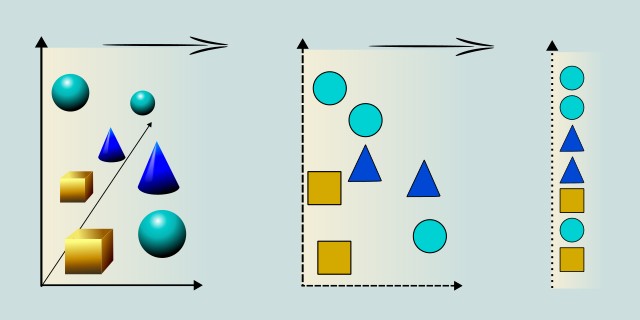
- If your dataset has too many features and you want to simplify it, choose Dimensionality Reduction.
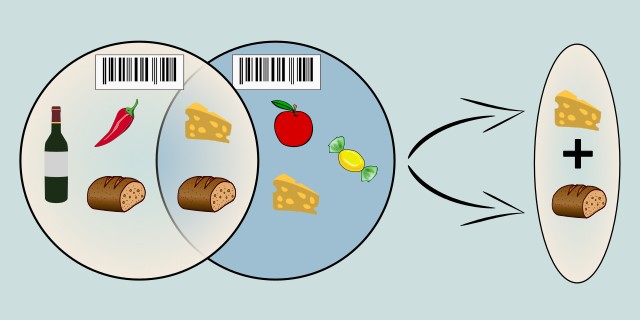
- If you want to discover interesting relationships or patterns between features, choose Association Rule Learning.
Clustering

Clustering is a type of unsupervised learning where the model groups similar data points together based on their features. It is used when you want to discover inherent structures in your data without predefined labels, such as customer segmentation, image compression, or anomaly detection.
Clustering is an unsupervised learning technique used to group data points into clusters based on similarity, without needing labeled data. It’s especially useful for data exploration, pattern discovery, or segmentation tasks where the underlying structure is unknown. Clustering algorithms aim to maximize intra-cluster similarity and minimize inter-cluster similarity. Different algorithms like K-Means, DBSCAN, and Hierarchical Clustering use different strategies to define and identify clusters. Choosing the right algorithm depends on the shape, density, and scale of the data. Evaluation is typically done using metrics like silhouette score or domain-specific validation.
Use Case Examples:
- Customer Segmentation: Grouping customers based on purchasing behavior for targeted marketing.
- Image Segmentation: Dividing images into regions with similar visual characteristics.
- Anomaly Detection: Identifying outliers in network traffic or sensor data by clustering normal patterns.
- Document Clustering: Automatically organizing news articles or research papers into topical groups.
- Genomic Data Analysis: Grouping genes or samples with similar expression profiles for biological insights.
Dimensionality Reduction

Dimensionality reduction is a technique used to reduce the number of features in a dataset while preserving its essential characteristics. It is particularly useful for visualizing high-dimensional data, improving model performance, and reducing computational costs.
Dimensionality Reduction is an unsupervised learning approach used to reduce the number of input variables or features in a dataset while preserving as much relevant information as possible. It is commonly applied in situations where datasets have a high number of variables (high dimensionality), which can lead to problems like overfitting or the curse of dimensionality. Techniques like PCA (Principal Component Analysis) and t-SNE (t-distributed Stochastic Neighbor Embedding) help simplify data, improve model performance, and aid in visualization. PCA is linear and focuses on variance, while t-SNE is non-linear and emphasizes local structure. Dimensionality reduction is often a key preprocessing step before clustering or classification.
Use Case Examples:
- Data Visualization: Reducing complex, high-dimensional datasets (like word embeddings or gene expression data) to 2D or 3D for visual exploration.
- Noise Reduction: Filtering out noise in sensor or image data by keeping only the most informative components.
- Feature Compression: Creating compact and efficient representations for tasks like facial recognition.
- Speeding Up Training: Reducing training time by lowering input dimensionality in large-scale machine learning pipelines.
- Preprocessing for Clustering: Applying PCA or t-SNE to better prepare data for clustering methods such as K-Means.
Association Rule Learning

Association rule learning is a method used to discover interesting relationships between variables in large datasets. It is commonly used in market basket analysis, where the goal is to find sets of products that frequently co-occur in transactions.
Association Rule Learning is an unsupervised learning technique used to identify interesting relationships, patterns, or correlations among a set of items in large datasets. It is most widely known for its application in market basket analysis, where it helps discover which products are frequently bought together. This method generates rules in the form of IF-THEN statements based on support, confidence, and lift metrics. Two commonly used algorithms are Apriori, which generates candidate itemsets iteratively, and Eclat, which uses a more efficient vertical data format. While highly interpretable, association rule learning is computationally intensive on large datasets and requires careful threshold tuning to avoid a combinatorial explosion of rules.
Use Case Examples:
- Market Basket Analysis: Identifying products that are often purchased together (e.g. bread → butter).
- Website Navigation Optimization: Discovering user click patterns to improve page layout and content flow.
- Fraud Detection: Finding unusual combinations of transactions that may indicate fraudulent activity.
- Medical Diagnosis: Uncovering associations between symptoms and diseases in patient records.
- Content Recommendation: Suggesting related videos, books, or articles based on item co-occurrence.
Feedback & Sharing
Give us your thoughts on this page, or share it with others who may find it useful.
Feedback
Found this helpful? Let me know what you think or suggest improvements 👉 Contact me.