Clustering
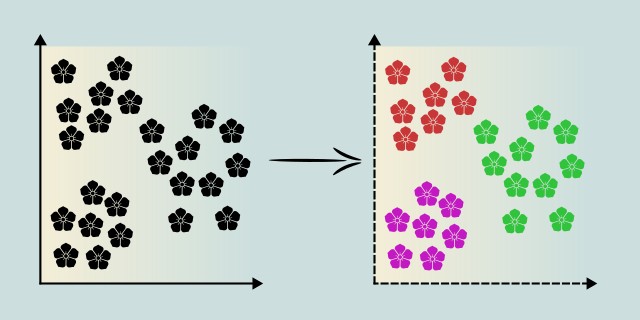
Clustering is a type of unsupervised learning where the model groups similar data points together based on their features. It is used when you want to discover inherent structures in your data without predefined labels, such as customer segmentation, image compression, or anomaly detection.

What kind of clusters do you expect in your data?
Is the number of clusters known in advance? Do you expect spherical shapes, noise, or nested groups?
Tips:
- If you know the number of clusters in advance and expect spherical, equally sized groups, choose K-Means.
- If your data has irregular shapes, noise, or varying densities, choose DBSCAN.
- If you’re interested in nested clusters or don’t know how many groups exist, choose Hierarchical Clustering.
K-Means

K-Means is an unsupervised clustering algorithm that partitions data into K distinct clusters based on similarity. It assigns each data point to the nearest cluster centroid and updates the centroids iteratively to minimize intra-cluster variance.
K-Means is widely used due to its simplicity and efficiency, especially on large datasets. It works well when clusters are spherical and equally sized but struggles with non-convex or varied-density clusters. The algorithm requires specifying the number of clusters (K) in advance, which can be a limitation. Techniques like the Elbow Method or Silhouette Score are often used to estimate the optimal number of clusters.
Use Case Examples:
- Customer Segmentation: Grouping customers based on purchasing behavior.
- Image Compression: Reducing image color space by clustering similar colors.
- Market Basket Analysis: Grouping products based on purchase patterns.
- Social Network Analysis: Identifying communities within social graphs.
- Anomaly Detection: Finding outliers as data points not belonging to any major cluster.
| Criterion | Recommendation |
|---|---|
| Dataset Size | 🟡 Medium / 🔴 Large |
| Training Complexity | 🟡 Medium |
DBSCAN

DBSCAN is a density-based clustering algorithm that groups together points that are closely packed and marks points in low-density regions as outliers. It does not require specifying the number of clusters in advance and is well-suited for discovering clusters of arbitrary shape.
DBSCAN works by defining two parameters: epsilon (ε), the radius of the neighborhood around a point, and minPts, the minimum number of points required to form a dense region. It’s especially effective when the dataset contains clusters of varying shapes and noise. However, it can struggle with clusters of varying densities and is sensitive to the choice of ε and minPts. It doesn’t perform well on high-dimensional data without preprocessing.
Use Case Examples:
- Geographic Data Analysis: Grouping spatial data like GPS coordinates to detect areas of high activity (e.g., urban planning, delivery hotspots).
- Anomaly Detection: Identifying noise points or outliers in data such as fraudulent transactions or defective manufacturing products.
- Astronomy: Detecting celestial object clusters in telescope data.
- Social Media Analysis: Clustering posts or users based on topic proximity.
- Seismic Event Detection: Grouping earthquake epicenters to identify tectonic structures.
| Criterion | Recommendation |
|---|---|
| Dataset Size | 🟡 Medium |
| Training Complexity | 🔴 High |
Hierarchical Clustering

Hierarchical Clustering is an unsupervised learning method that builds a hierarchy of clusters either agglomeratively (bottom-up) or divisively (top-down). It does not require specifying the number of clusters in advance and produces a dendrogram, a tree-like diagram that visualizes cluster relationships.
In agglomerative hierarchical clustering, each point starts as its own cluster and pairs of clusters are merged based on distance metrics (like Euclidean or Manhattan). The process continues until all points belong to one cluster. It's intuitive and especially useful for small to medium datasets. However, it can be computationally expensive on large datasets and sensitive to noise and outliers. Once a merge or split is made, it cannot be undone, making it less flexible than other clustering methods.
Use Case Examples:
- Gene Expression Analysis: Grouping genes with similar expression patterns across samples.
- Customer Segmentation: Building hierarchies of customer profiles for targeted marketing.
- Document Classification: Clustering similar articles or research papers based on content.
- Organizational Structure Mapping: Visualizing team relationships and hierarchies.
- Sociological Studies: Grouping people based on shared behavioral or demographic traits.
| Criterion | Recommendation |
|---|---|
| Dataset Size | 🟢 Small |
| Training Complexity | 🔴 High |
Feedback & Sharing
Give us your thoughts on this page, or share it with others who may find it useful.
Feedback
Found this helpful? Let me know what you think or suggest improvements 👉 Contact me.