Dimensionality Reduction
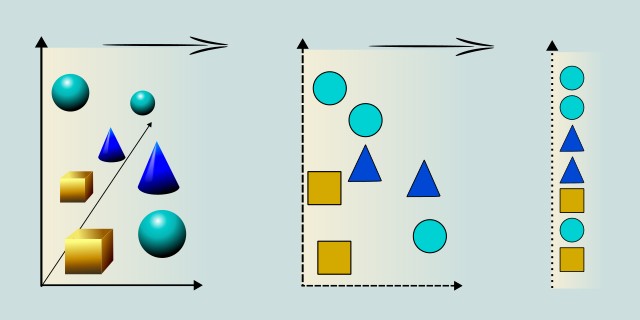
Dimensionality reduction is a technique used to reduce the number of features in a dataset while preserving its essential characteristics. It is particularly useful for visualizing high-dimensional data, improving model performance, and reducing computational costs.

What is your goal when reducing dimensionality?
Do you need a fast and interpretable method for feature reduction, or a detailed visualization of complex patterns?
Tips:
- If you want a linear, fast, and interpretable method to reduce the number of features, choose PCA (Principal Component Analysis).
- If your goal is to visualize complex nonlinear patterns or clusters in 2D or 3D, choose t-SNE (t-Distributed Stochastic Neighbor Embedding).
PCA

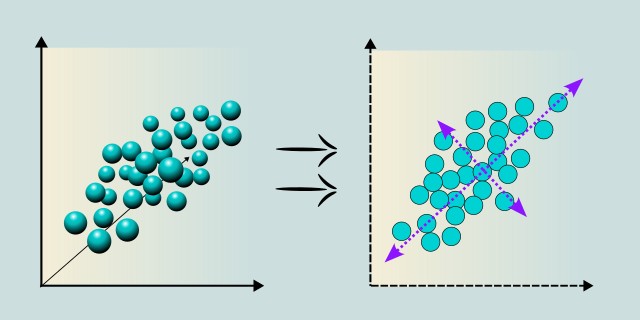
Principal Component Analysis (PCA) is a dimensionality reduction technique that transforms high-dimensional data into a smaller set of linearly uncorrelated variables called principal components. It helps simplify data while preserving as much variance as possible.
PCA works by identifying the directions (principal components) in which the data varies the most and projecting the data onto these axes. It's widely used for visualization, noise reduction, and preprocessing before applying other machine learning algorithms. PCA assumes linearity in the data and is sensitive to the scale of features, so normalization is typically required. While powerful, it may lose interpretability as the transformed features no longer have original semantic meaning.
Use Case Examples:
- Face Recognition: Reducing pixel data to extract facial features efficiently.
- Stock Market Analysis: Compressing high-dimensional financial data into key movement patterns.
- Gene Data Compression: Analyzing genetic expression data with thousands of features.
- Image Compression: Reducing the number of dimensions in image data for storage and processing.
- Anomaly Detection: Identifying deviations in principal component space in manufacturing data.
| Criterion | Recommendation |
|---|---|
| Dataset Size | 🟡 Medium |
| Training Complexity | 🟢 Low |
t-SNE

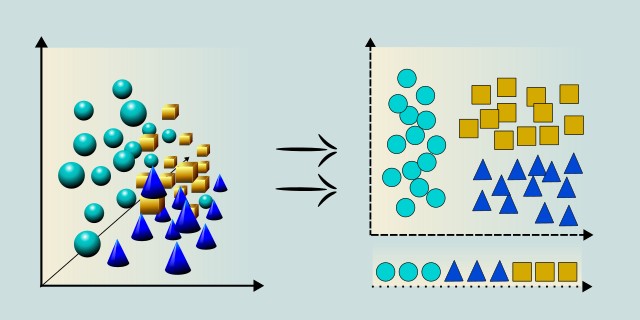
t-SNE is a non-linear dimensionality reduction technique primarily used for visualizing high-dimensional data in 2D or 3D space. It emphasizes preserving local structure, making it effective at revealing clusters or groupings in complex datasets.
Unlike PCA, which finds linear combinations of features, t-SNE uses probability distributions to model similarities between points and attempts to preserve these relationships when projecting to lower dimensions. It's particularly useful for exploratory data analysis and visual inspection of embeddings like word vectors or image data. However, t-SNE is computationally intensive, not ideal for very large datasets, and not suitable for downstream tasks like classification or regression due to its non-deterministic nature and lack of invertibility.
Use Case Examples:
- Visualizing Word Embeddings: Mapping high-dimensional word vectors (e.g., from Word2Vec) into a 2D plot.
- Genomic Data Clustering: Exploring structure in gene expression datasets.
- Customer Segmentation: Visualizing purchase behavior clusters.
- Image Similarity Exploration: Understanding how CNNs group images in feature space.
- Fraud Detection Insight: Visualizing potential clusters of fraudulent behavior in financial datasets.
| Criterion | Recommendation |
|---|---|
| Dataset Size | 🟢 Small |
| Training Complexity | 🔴 High |
Feedback & Sharing
Give us your thoughts on this page, or share it with others who may find it useful.
Feedback
Found this helpful? Let me know what you think or suggest improvements 👉 Contact me.